Troubleshoot Secure Endpoint Mac Connector Diagnostic Data
Available Languages
Introduction
This document describes how to generate a diagnostic file with the Support Tool application on the Cisco Secure Endpoint Mac connector.
Environment
Requirements
Cisco recommends that you have knowledge of these topics:
- macOS
- Secure Endpoint Mac Connector
Components Used
The information in this document is based on the Secure Endpoint Mac Connector.
The information in this document was created from the devices in a specific lab environment. All of the devices used in this document started with a cleared (default) configuration. If your network is live, ensure that you understand the potential impact of any command.
Issue
The Secure Endpoint Mac connector includes an application called the Support Tool. This is used to generate diagnostic information on the connector installed on your Mac. The diagnostic data includes information on your Mac such as:
- Resource utilization (disk, CPU, and memory)
- Connector-specific logs
- Connector configuration information
Generate a Diagnostic File with the Support Tool
This section describes how to launch the Support Tool application from the GUI or the CLI to generate a diagnostic file.
Launch the Support Tool Using macOS Finder
Complete these steps to launch the Secure Endpoint Mac connector Support Tool using the macOS Finder:
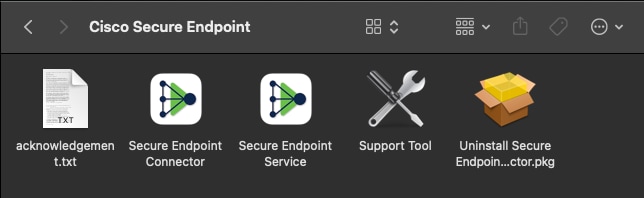
1. Navigate to the Cisco Secure Endpoint directory in your Applications folder and locate the Support Tool launcher:
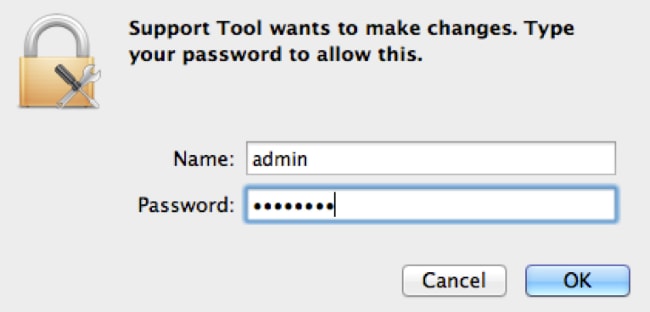
2. Double-click the Support Tool launcher. The system prompts for administrative credentials:
3. After credentials are entered, the Support Tool icon appears in the dock:

4. When the Support Tool application completes, it generates a file and places it on the desktop:
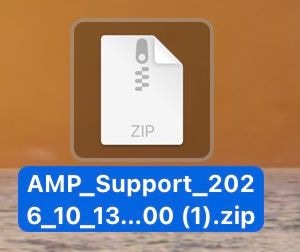 Pasted 18-10-2026 at 11.38.59.jpeg
5. This image shows an example of the uncompressed output:
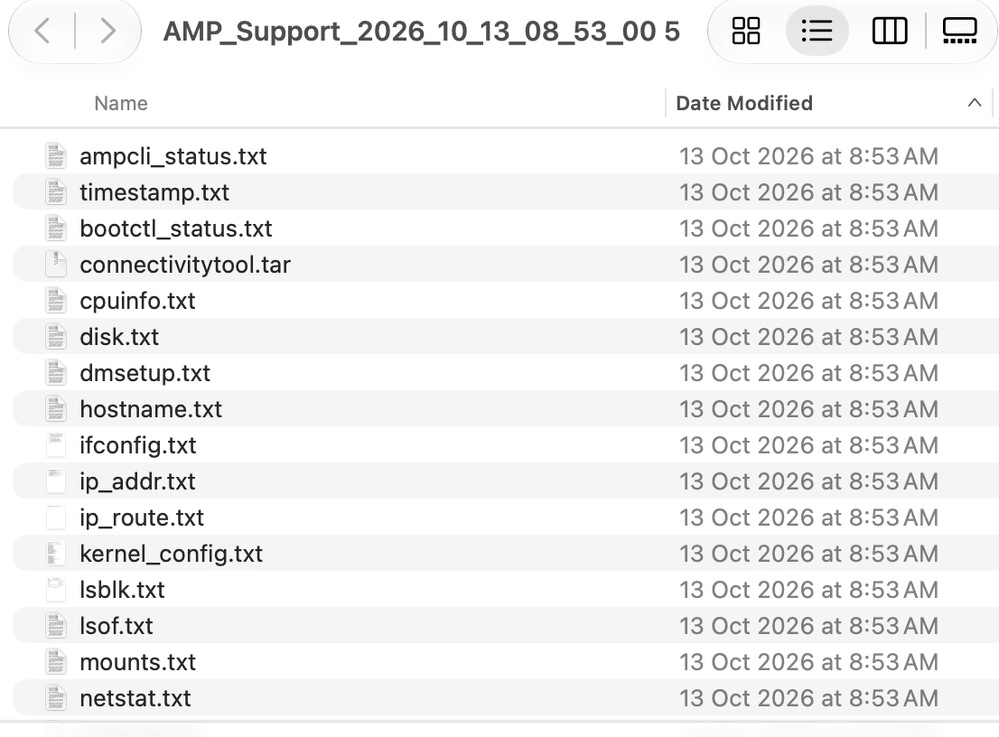 Screenshot 2026-10-18 at 11.39.51 AM.png
6. To analyze the data, provide this file to the Cisco Technical Support Team.
Launch the Support Tool Using macOS Terminal
The Support Tool launcher is located in this directory:
/Library/Application Support/Cisco/AMP for Endpoints Connector/To launch the Support Tool application, run the next command:
root@mac# cd /Library/Application\ Support/Cisco/AMP\ for\ Endpoints\ Connector
root@mac# ./SupportToolTroubleshooting
This section describes how to enable and disable debug mode on the Secure Endpoint Mac connector to troubleshoot performance issues.
Enable Debug Mode
Debug mode is useful when you troubleshoot performance issues on a Secure Endpoint connector. Complete these steps to enable debug mode and collect diagnostic data.
1. Log in to the Secure Endpoint Console.
2. Navigate to Management > Policies.
1. Locate a policy that is applied to a computer, click on the policy, which expands the policy window, and click Duplicate. The Secure Endpoint Console updates with the duplicated policy:
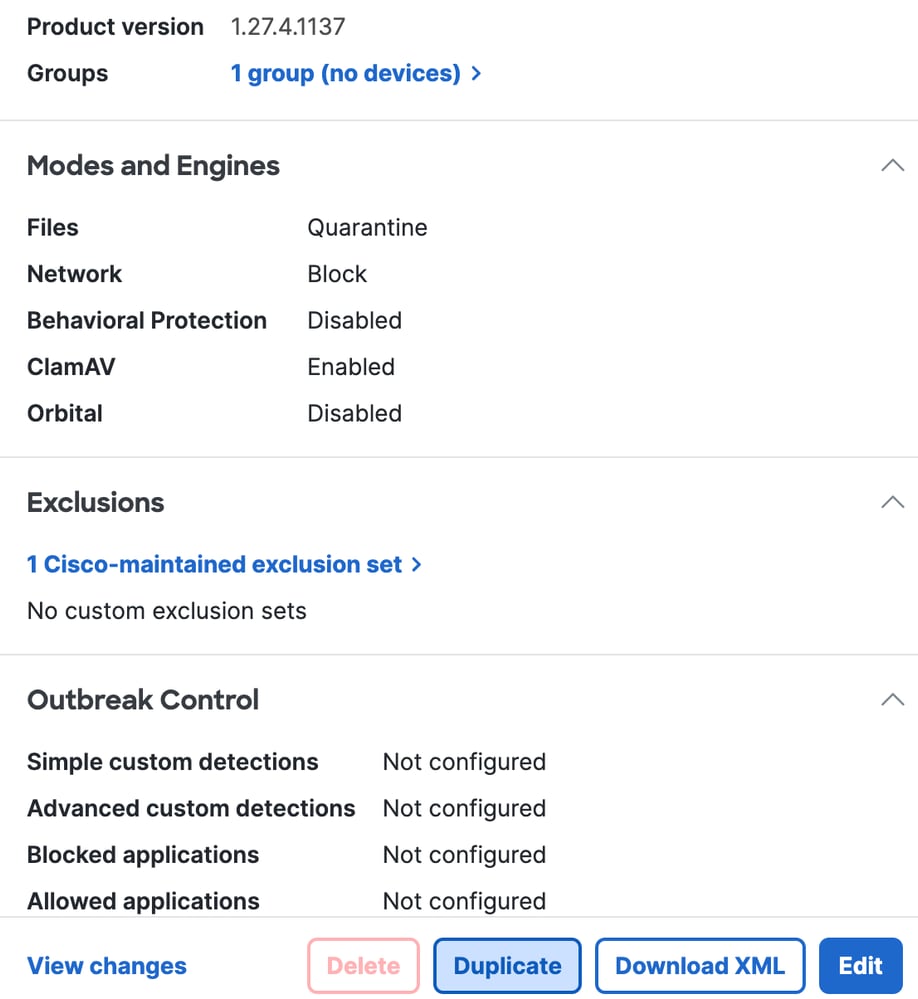 Screenshot 2026-10-18 at 11.50.48 AM.png
2. Select and expand the duplicate policy window, click Edit and change the name of the policy. For example, you can use Debug TechZone MAC Policy.
3. Click Advanced Settings, select Administrative Features from the sidebar, and select Debug for both the connector Log Level and Tray Log Level drop down menus:
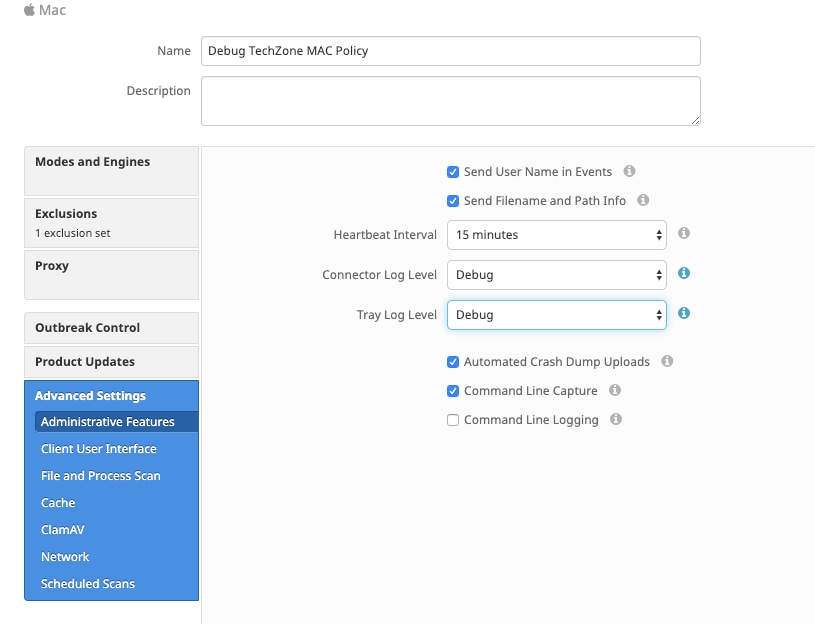
4. Click Save.
5. Navigate to Management > Groups and click Create Group near the top-right side of your screen.
6. Enter a name for the group. For example, you can use Debug TechZone Mac Group.
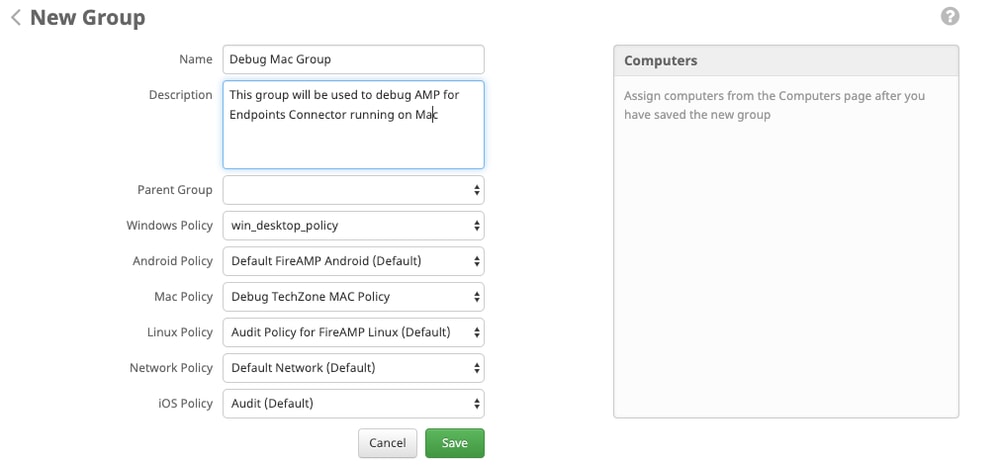
7. Change the Mac Policy from Default Mac Policy to the duplicated, new policy you just created, which is the Debug TechZone Mac Policy in this example. Click Save.
8. Navigate to Management > Computers and identify your computer in the list. Select it and click Move to Group...
9. Select your newly created group from the Select Group drop-down menu. Click Move to move the selected computer into your new group. Your Mac now has a functional debug policy. You can select the Secure Endpoint icon that appears on your menu bar and ensure it has the new policy:
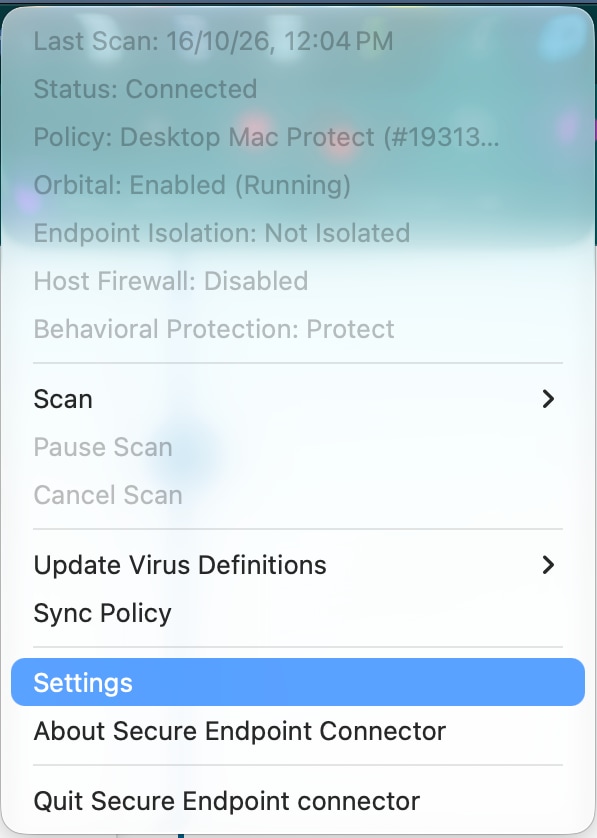 Screenshot 2026-10-18 at 11.55.26 AM.png
Enable Single Heartbeat Debug Mode
This procedure is only available for the 1.0.4 connector and later. It allows a single connector to be put into debug mode until the next heartbeat. The heartbeat is the connector's scheduled check-in interval with the management service. Depending on the heartbeat interval, this procedure does not capture all activity required for a full diagnostic analysis.
1. Go to Settings.
2. Click About.
3. On the About page, click the right half of the Secure Endpoint logo.
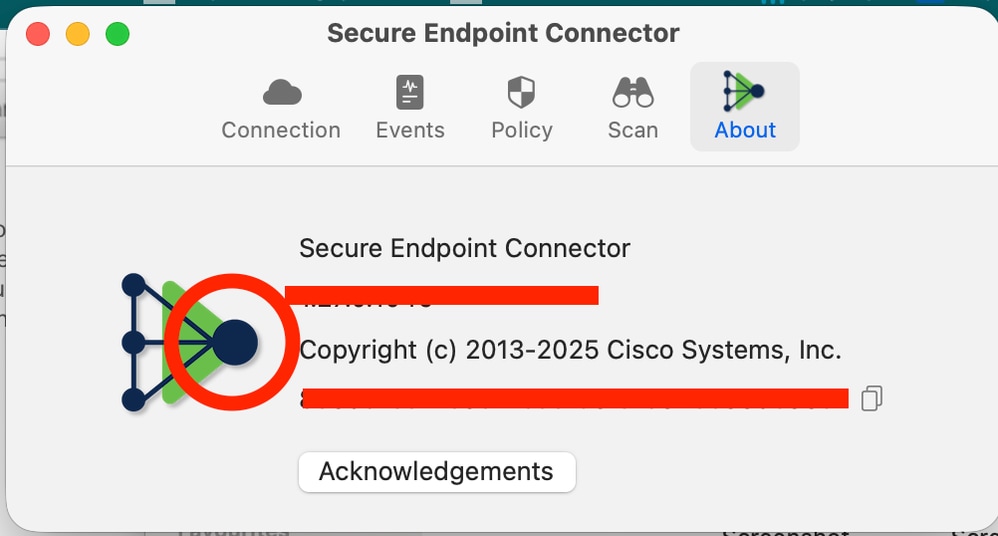 Screenshot 2026-10-18 at 11.56.57 AM.png
1. If the prior steps were completed correctly, the notice appears on the right side of the screen:
 Screenshot 2026-10-18 at 11.59.09 AM.png
2. Debug automatically disables after the next heartbeat.
Disable Debug Mode
After the diagnostic data in debug mode is obtained, revert the Secure Endpoint connector to normal mode. Complete these steps to disable debug mode:
1. Log in to the Secure Endpoint Console.
2. Navigate to Management > Groups.
3. Locate the new group, Debug TechZone Mac Group, that you created in debug mode.
4. Click Edit.
5. In the Computers window located towards the top-right of your screen, locate your computer in the list. Select it, which takes you to the Computers page. Once again, select your computer from the list, and click Move to Group...
6. Select your previous group from the Select Group drop-down menu. Click Move to move the selected computer into the previous group.
7. Click on the Secure Endpoint icon in your menu bar. Select Sync Policy from the menu.
8. Verify the policy is now returned to the previous default value. Check this on the menu bar. The policy has now reverted back to the original policy that was used before you changed it to the Debug TechZone Mac Group:
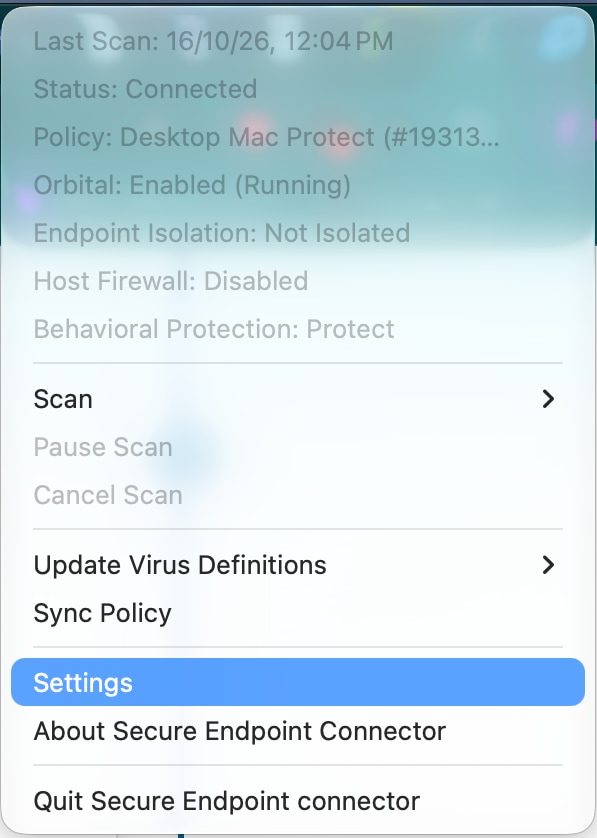 Screenshot 2026-10-18 at 11.55.26 AM.png
9. Debug mode is now disabled, and the Secure Endpoint connector can now function normally.
Revision History
| Revision | Publish Date | Comments |
|---|---|---|
3.0 |
20-Oct-2026
|
Updated spelling, grammar, spacing, inserted horizontal lines to separate sections for readability, updated alt text, fixed CCW alerts. |
2.0 |
04-Mar-2022
|
Fixed formatting |
1.0 |
04-Mar-2022
|
Initial Release |

 Feedback
Contact Cisco
- Open a Support Case

- (Requires a Cisco Service Contract)